May Jobs Resets Recession Expectations, but Hardens Inflation Expectations
New May jobs printed at 339,000 on June 2, according to the Establishment Survey, well above market expectations of 180,000 jobs. Net revisions were were also up 93,000 jobs from March and April. That makes the average three-month jobs creation over 283,000 jobs. The Households Survey, which is compiled from different data, showed just 175,000 jobs created. The unemployment rate ticked up to 3.7 percent, up from 3.4 percent in April. The number of unemployed persons increased by 440,000 people from the April figures to 6,097,000. The U6 number was 6.7 percent, up from 6.6 percent in April. The U6 is a measure of the total unemployed plus all persons marginally attached to the labor force plus total employed part-time for economic reasons, as a percent of the civilian labor force, plus all persons marginally attached to the labor force. The labor participation rate remained 62.6 perecent. Let’s look at our exclusive chart of jobs creation by average weekly wages: (Source: The Stuyvesant Square Consultancy / Chart: April/May jobs creation by average weekly wages from May Bureau of Labor Statistics data (c) 2023. (1) Includes other industries, not shown separately.) Annual real (i.e., adjusted for inflation) wages, which we present quarterly, declined in May in all categories of employment, except mining and logging, construction, and the wholesale trade. Employment in sectors that tend not to have government support had their biggest gains in professional and business services followed by the lower-wage leisure and hospitality sector. Educationa and health services, which includes the health care and social assistance sector, and that tend to have considerable government support, printed near 100,000 of the total new jobs reported today. Entitlement programs such as Medicare and Medicaid, as well as federally guaranteed student loans, tend to supplement employment in those industries. Pure government employment, which we do not reflected in our chart, added another 56,000 jobs. Other Data The May ISM Manufacturing Index printed at 46.9 on Thursday, down from at 47.1 in April and below expectations. The ISM Services Index for May has not yet printed. The Job Opening and Labor Turnover Survey (JOLTS) print for April, which printed on May 31, was up with 358,000 new job openings, so fairly in line with the June 2 print of jobs creation. Building permits in April, released on May 17, were at a seasonally adjusted annual rate of 1,416,000. This is 1.5 percent below the revised March rate of 1,437,000 and is 21.1 percent below the April 2022 rate of 1,795,000. Privately owned housing starts in April were at a seasonally adjusted annual rate of 1,401,000. This is 2.2 percent above the revised March estimate of 1,371,000, but is 22.3 percent (±8.7 percent) below the April 2022 rate of 1,803,000. For April, personal income and outlays, released May 26, showed disposable personal income up 0.4 percent in current dollars and zero percent in chained 2012 dollars. Personal income in current dollars was up 0.4 percent. The Personal Consumption Expenditures (PCE) Index, excluding food and energy, reported to be the Federal Reserve’s preferred measure of inflation, printed at 4.7 percent, up slightly from March. (“Chained dollars” is a measure of inflation that takes into account changes in consumer behavior in response to changes in prices.) The IBD/TIPP Economic Optimism Index, released on May 9, plunged 12.2 percent, to 41.6, and remains pessimistic. (Anything below 50 indicates contraction.) The June survey has not yet been released. The Federal Reserve’s so-called dot-plot projections from last March are now nearly three months old and will be revised and released for the next policy meeting of the Federal Open Market Committee on June 14–15. But the March figures showed a median estimate of GDP growth of 0.4 percent for 2023, 1.2 percent for 2024, and 1.9 percent for 2025. They also show inflation continuing above the Fed’s inflation target of 2 percent through at least 2025. Labor productivity continues to disappoint. Nonfarm business sector labor productivity decreased 2.1 percent in the first quarter of 2023. Opinion Today’s strong jobs numbers present the Federal Reserve with a troubling data point in its inflation fight. Strong jobs and low continuing unemployment means continuing inflation, at least if one abides the theory of the Phillips curve. The Phillips curve posits an inverse relationship between inflation and unemployment—that is, lower unemployment yields higher inflation. Many do not buy into it, however. The other side of the favorable jobs report are disappointing ISM Manufacturing and Services reports that are pointing toward contraction. The Fed’s Beige Book, which summarizes economic activity among each of the Fed’s regional bank territories, was also largely flat, with a couple of districts showing decline and some showing growth. But as the 4.7 pe

New May jobs printed at 339,000 on June 2, according to the Establishment Survey, well above market expectations of 180,000 jobs. Net revisions were were also up 93,000 jobs from March and April. That makes the average three-month jobs creation over 283,000 jobs.
The Households Survey, which is compiled from different data, showed just 175,000 jobs created.
The unemployment rate ticked up to 3.7 percent, up from 3.4 percent in April. The number of unemployed persons increased by 440,000 people from the April figures to 6,097,000.
The U6 number was 6.7 percent, up from 6.6 percent in April. The U6 is a measure of the total unemployed plus all persons marginally attached to the labor force plus total employed part-time for economic reasons, as a percent of the civilian labor force, plus all persons marginally attached to the labor force. The labor participation rate remained 62.6 perecent.
Let’s look at our exclusive chart of jobs creation by average weekly wages:
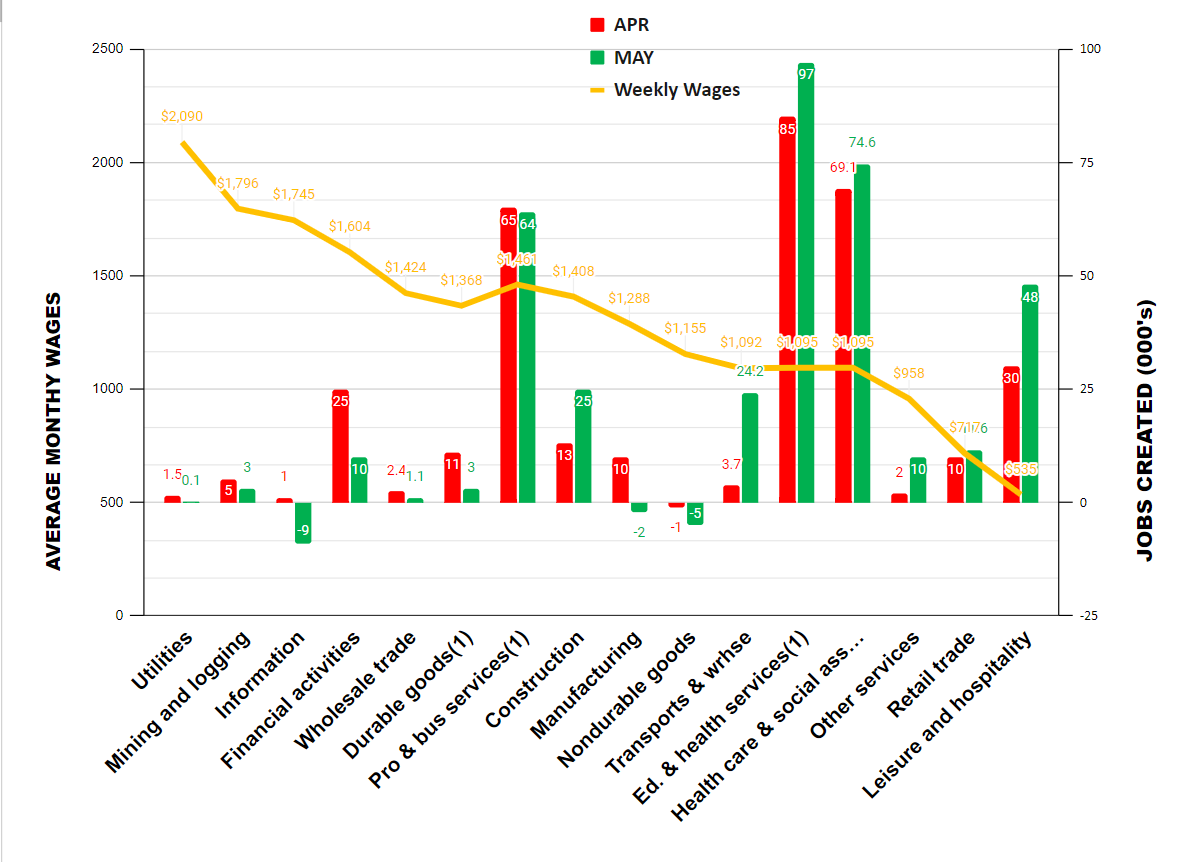
Annual real (i.e., adjusted for inflation) wages, which we present quarterly, declined in May in all categories of employment, except mining and logging, construction, and the wholesale trade.
Employment in sectors that tend not to have government support had their biggest gains in professional and business services followed by the lower-wage leisure and hospitality sector.
Educationa and health services, which includes the health care and social assistance sector, and that tend to have considerable government support, printed near 100,000 of the total new jobs reported today. Entitlement programs such as Medicare and Medicaid, as well as federally guaranteed student loans, tend to supplement employment in those industries. Pure government employment, which we do not reflected in our chart, added another 56,000 jobs.
Other Data
The May ISM Manufacturing Index printed at 46.9 on Thursday, down from at 47.1 in April and below expectations.
The ISM Services Index for May has not yet printed.
The Job Opening and Labor Turnover Survey (JOLTS) print for April, which printed on May 31, was up with 358,000 new job openings, so fairly in line with the June 2 print of jobs creation.
Building permits in April, released on May 17, were at a seasonally adjusted annual rate of 1,416,000. This is 1.5 percent below the revised March rate of 1,437,000 and is 21.1 percent below the April 2022 rate of 1,795,000.
Privately owned housing starts in April were at a seasonally adjusted annual rate of 1,401,000. This is 2.2 percent above the revised March estimate of 1,371,000, but is 22.3 percent (±8.7 percent) below the April 2022 rate of 1,803,000.
For April, personal income and outlays, released May 26, showed disposable personal income up 0.4 percent in current dollars and zero percent in chained 2012 dollars. Personal income in current dollars was up 0.4 percent. The Personal Consumption Expenditures (PCE) Index, excluding food and energy, reported to be the Federal Reserve’s preferred measure of inflation, printed at 4.7 percent, up slightly from March. (“Chained dollars” is a measure of inflation that takes into account changes in consumer behavior in response to changes in prices.)
The IBD/TIPP Economic Optimism Index, released on May 9, plunged 12.2 percent, to 41.6, and remains pessimistic. (Anything below 50 indicates contraction.) The June survey has not yet been released.
The Federal Reserve’s so-called dot-plot projections from last March are now nearly three months old and will be revised and released for the next policy meeting of the Federal Open Market Committee on June 14–15. But the March figures showed a median estimate of GDP growth of 0.4 percent for 2023, 1.2 percent for 2024, and 1.9 percent for 2025. They also show inflation continuing above the Fed’s inflation target of 2 percent through at least 2025.
Labor productivity continues to disappoint. Nonfarm business sector labor productivity decreased 2.1 percent in the first quarter of 2023.
Opinion
Today’s strong jobs numbers present the Federal Reserve with a troubling data point in its inflation fight. Strong jobs and low continuing unemployment means continuing inflation, at least if one abides the theory of the Phillips curve. The Phillips curve posits an inverse relationship between inflation and unemployment—that is, lower unemployment yields higher inflation. Many do not buy into it, however.
The other side of the favorable jobs report are disappointing ISM Manufacturing and Services reports that are pointing toward contraction. The Fed’s Beige Book, which summarizes economic activity among each of the Fed’s regional bank territories, was also largely flat, with a couple of districts showing decline and some showing growth.
But as the 4.7 percent core inflation number shows, inflation has continued despite a rapid hike in rates over the last several months. Today’s jobs number likely hardens consumers’ inflation expectations. That’s never a good thing in the inflation fight.
Last month, Fed officials, speaking at various different venues, seemed divided as to whether there might be a pause in the June meeting two weeks from now. It now seems unlikely there will be a pause. We expect a rate hike in the June meeting, tying to what we believe will ultimately be our estimate of a 6 percent terminal rate, but we also hope that the Fed will also accelerate and increase its sale of Fed balance sheet assets to remove excess cash from the economy. That will affect inflation far more, in our view.
We have long held that the issue with U.S. inflation is the Fed’s own massive balance sheet. It was expanded after the financial crisis of 2008–09, and then again during the pandemic. After throttling down somewhat a year ago, the Fed again expanded its balance sheet after the collapse of Silicon Valley Bank. The Fed balance sheet is $8.4 trillion now compared to just around $905 billion prior to the 2008 financial crisis. It has created an asset bubble and a mirage of prosperity. But any hope of returning to a normal economy requires that number to be returned to less than a $1 trillion.
Until we stop so much cash from sloshing around in the Fed balance sheet, inflation will continue and businesses will suffer with higher rates, but with little or no affect on inflation. There will be more bankruptcies as rates continue to increase and squeeze margins, and more pain for would-be homeowners—but little relief from inflation.
We note, too, that the new debt-ceiling deal, with what some anticipate will be at least an additional $4 trillion in debt, will only serve to accelerate inflation and exacerbates the Fed’s inability to reduce its balance sheet.
Outlook
We revise up our predictions. We now estimate second-quarter 2023 GDP will print between 1 percent and 1.5 percent and we withdraw our earlier estimate of a second-quarter start to a recession. That may change if the Fed moves to reduce its balance sheet in the meeting later this month, but we do not expect that to happen.
________________________________________________________